Sub Bottom Profiler & Side Scan Sonar Bathymetric Survey In Africa
Call: +91 80746 92090
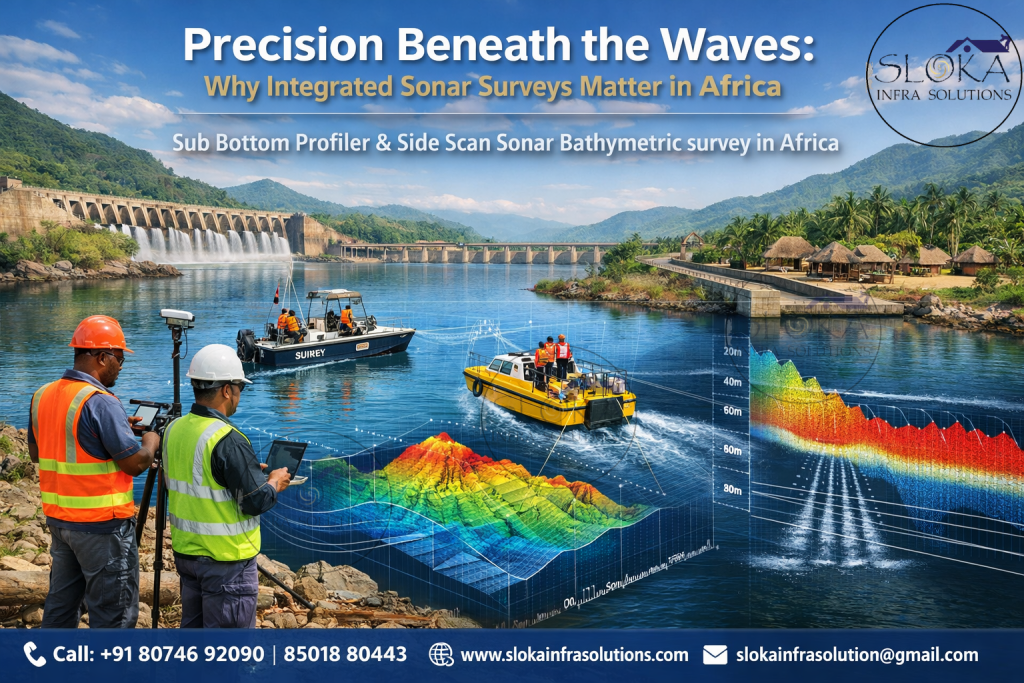
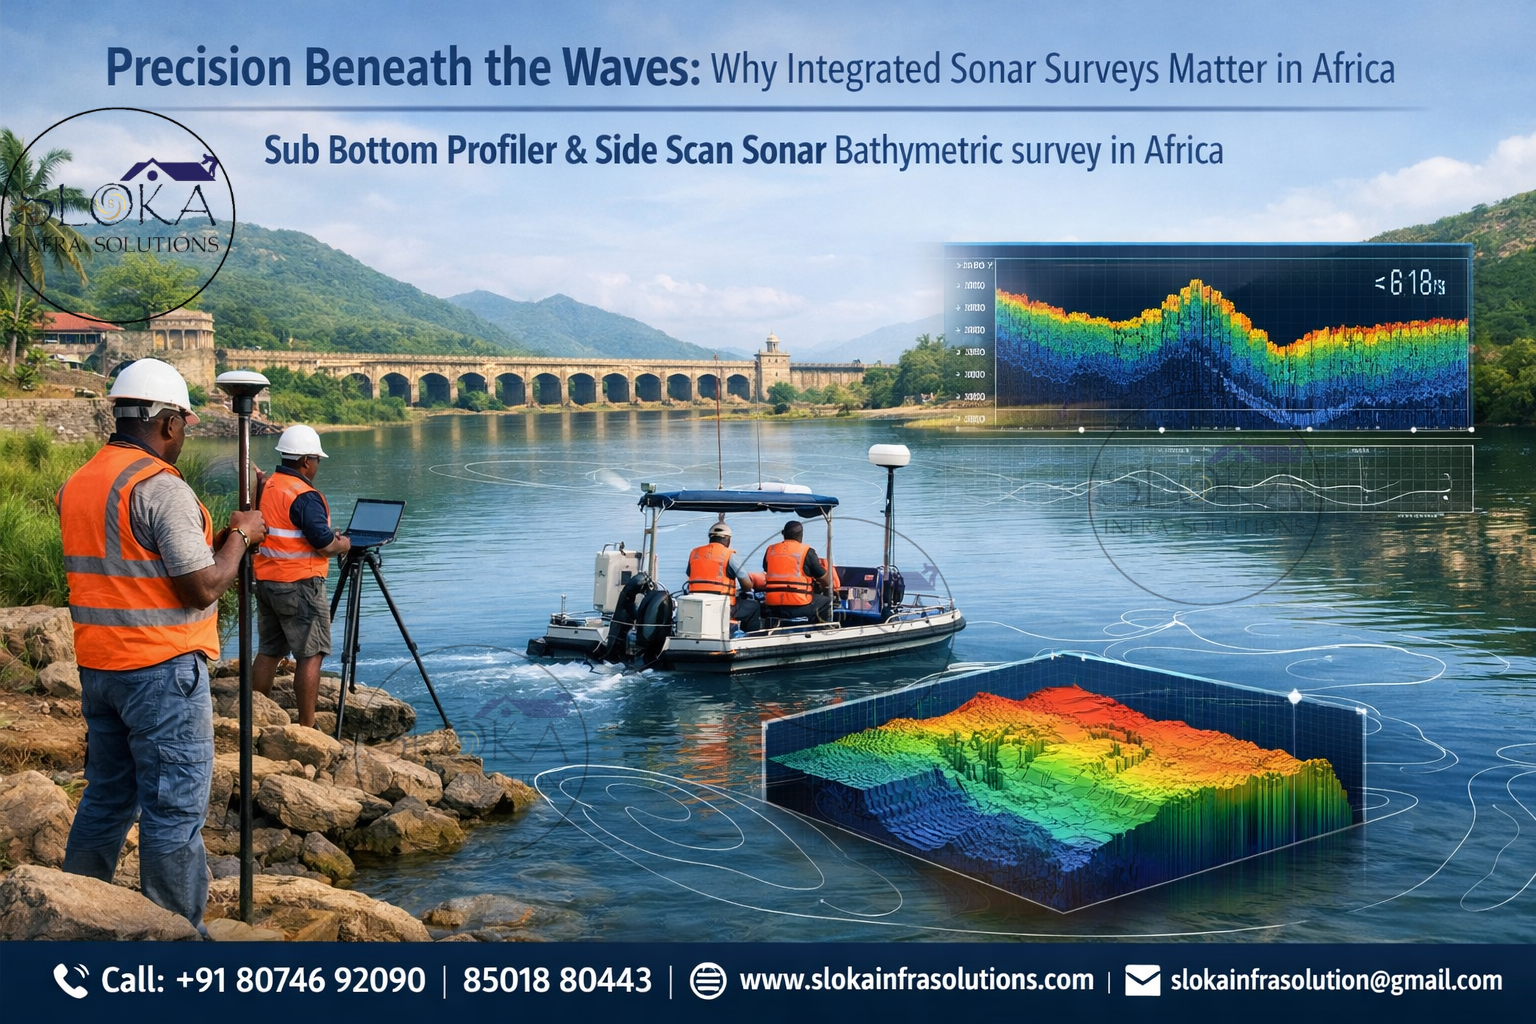
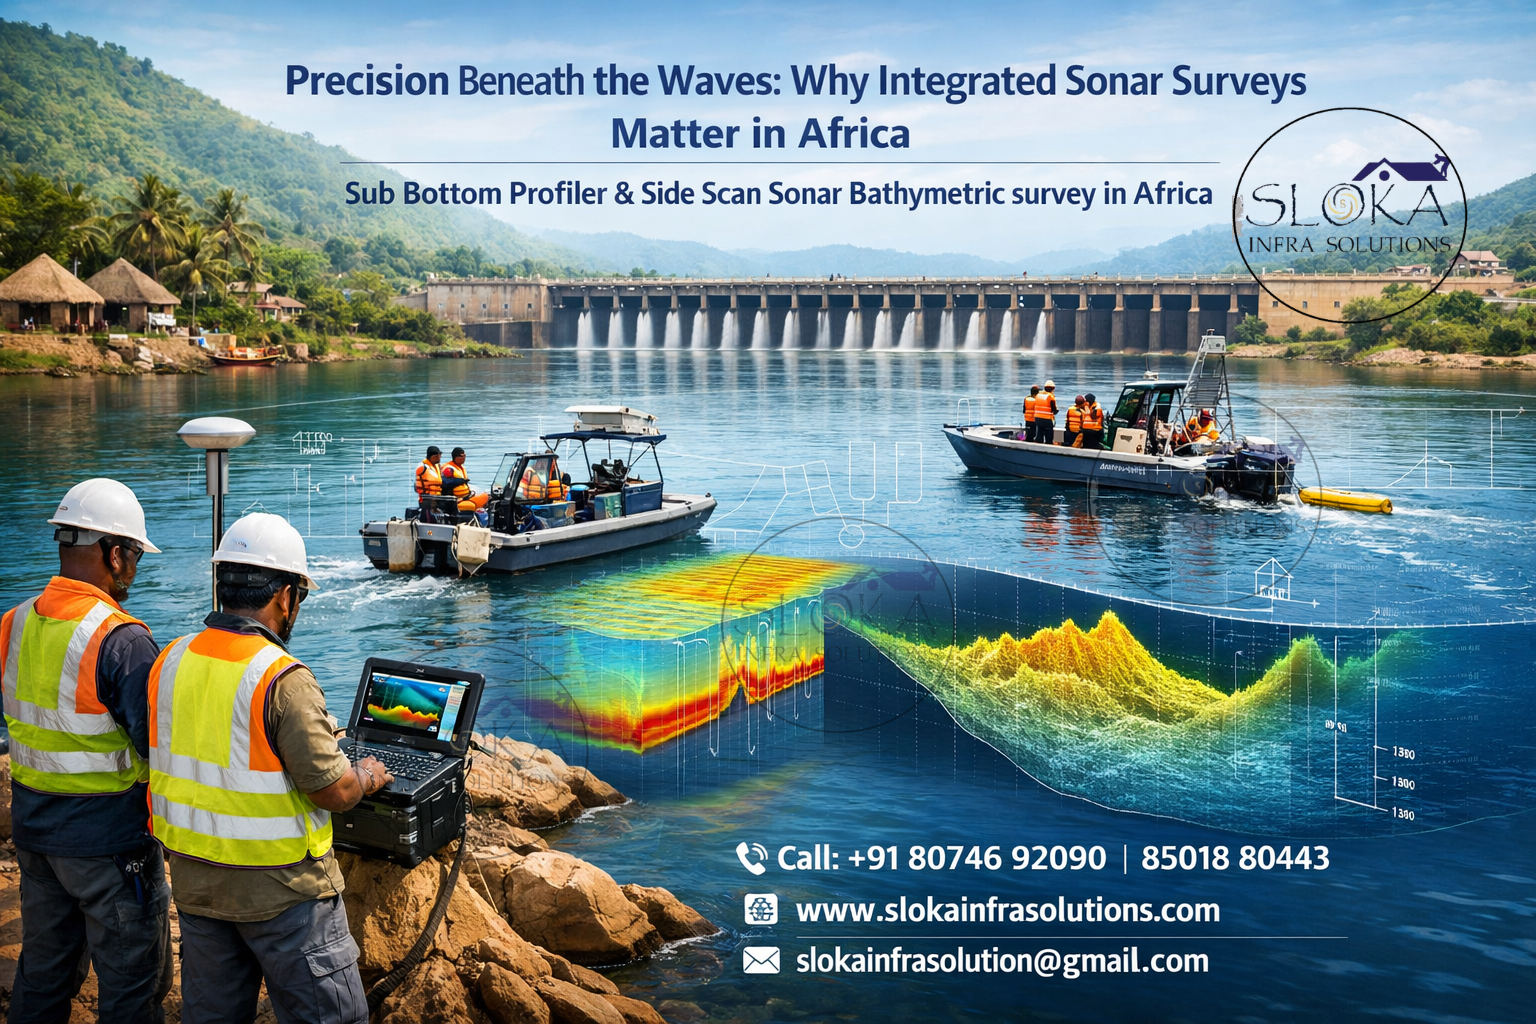
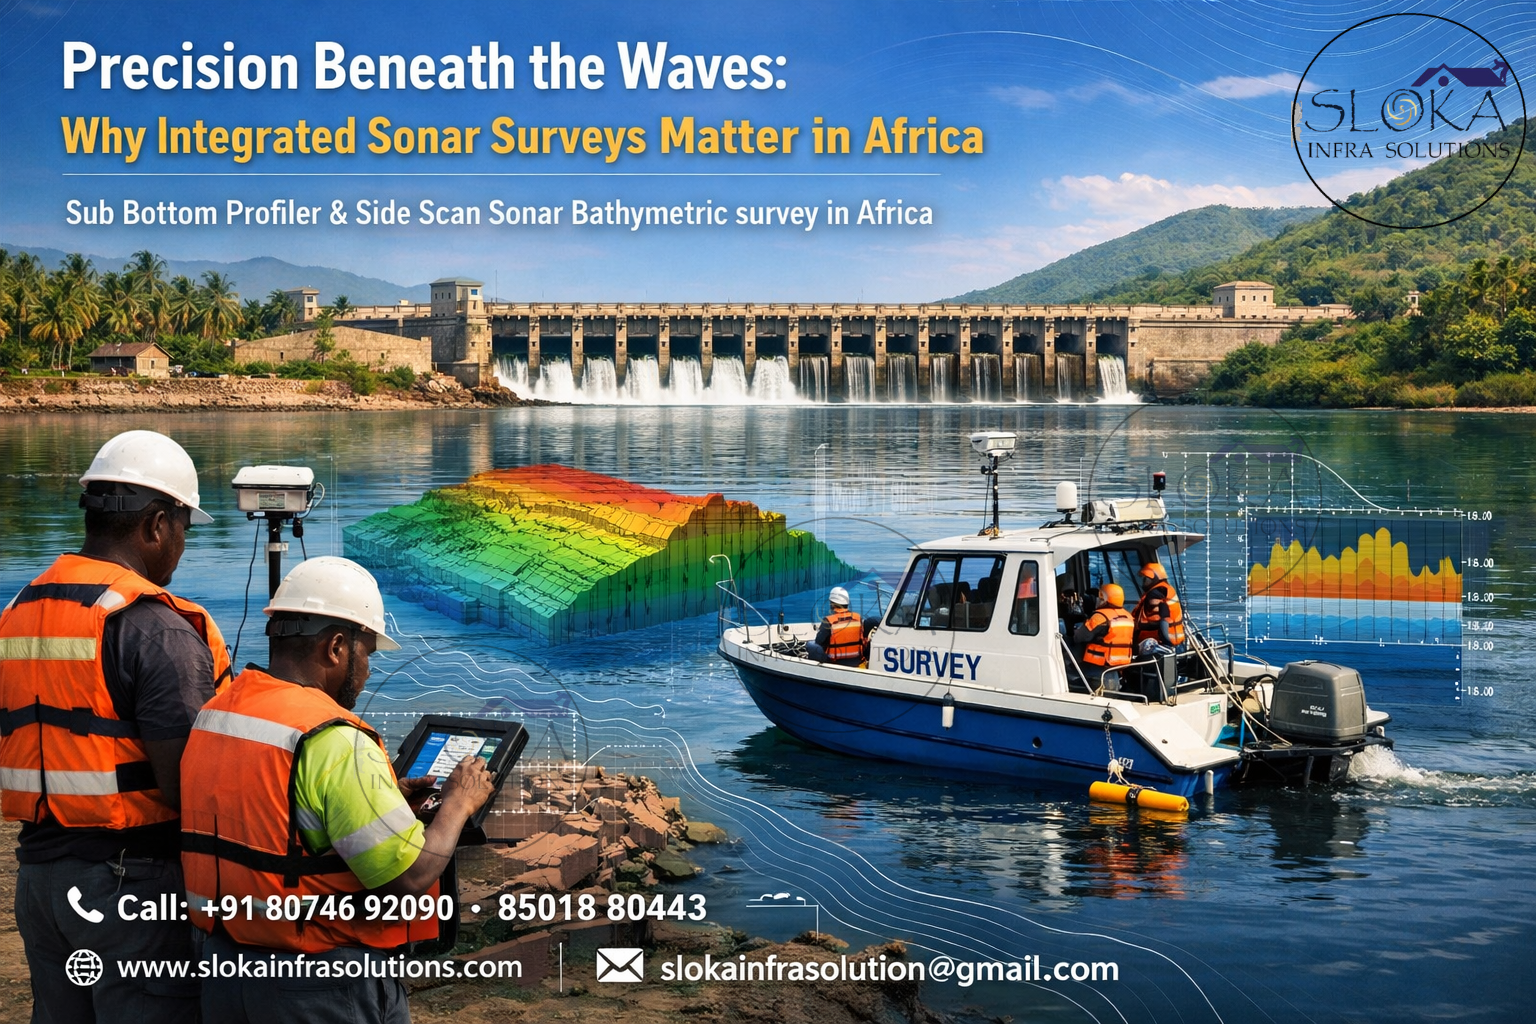
Precision Beneath the Waves: Why Integrated Sonar Surveys Matter in Africa:-
Sub Bottom Profiler & Side Scan Sonar Bathymetric survey in Africa opens a world of subsurface detail and high-resolution seabed imagery that governments, ports, researchers and private developers across the continent increasingly rely on to make safe, cost-effective marine decisions. This post explains how sub-bottom profilers and side-scan sonar work, how they integrate with bathymetric surveys, why they matter specifically for Africa’s rivers, lakes, coastal shelf and offshore zones, and—critically—how to plan, execute and interpret surveys so you get reliable, actionable results.
Sub Bottom Profiler & Side Scan Sonar Bathymetric surveyor in Africa
Sub Bottom Profiler & Side Scan Sonar Bathymetric surveyor in Africa must combine geophysical insight with practical knowledge of regional waters — seasonal rivers, vast inland lakes (like Victoria and Tanganyika), long and varied coastlines (Mediterranean, Atlantic, Indian Ocean), and offshore sedimentary basins — to deliver surveys that are accurate, safe and fit for purpose. The rest of this article digs into the tools and workflows these specialists use, examples of where they make a difference, and a practical guide to rig selection, data processing and reporting that’s tailored to Africa’s environments.
Why integrate sub-bottom profiling and side-scan sonar with bathymetry?
At a high level:
Bathymetry (depth mapping) gives you the shape of the seafloor.
Side-scan sonar gives you a high-resolution acoustic image of the seafloor texture and objects (wrecks, debris, boulders, pipeline sections).
Sub-bottom profilers image the layers beneath the seafloor — sediment thickness, buried channels, shallow bedrock, and potential hazards.
Combining these three delivers a complete picture: “how deep is the sea?”, “what does the surface look like?” and “what lies under the surface?” — the trifecta for safe navigation, port design, dredging, cable/pipeline routing and environmental assessments. The definition and core function of sub-bottom profilers are well summarized by the U.S. National Oceanic and Atmospheric Administration (NOAA). NOAA Ocean Exploration.
The core instruments — what they do and how they differ?
Sub-bottom profilers (SBP) —Sub-bottom profilers are low-frequency acoustic systems designed to penetrate the seafloor and reflect energy from subsurface interfaces. There are different families:
Boomer / Sparker — higher energy, deeper penetration (tens of meters in favorable sediments), good for imaging coarse beds and deeper stratigraphy. Unique Group’s overview explains boomer systems and use cases. Unique Group.
Chirp / Sweep systems — provide high vertical resolution for shallow penetration (decimeters to a few tens of meters, depending on sediment and depth). These are excellent for engineering studies and determining thin sediment layers. Applied Acoustic’s guide describes chirp advantages and pulse techniques. Applied Acoustics.
SBPs are towed or hull-mounted; choice comes down to required penetration, resolution, and tolerance to sea state.
Side-scan sonar
Side-scan sonar casts fan-shaped acoustic pulses to each side of the towbody and records backscatter intensity, producing photographic-like images of the seabed that are ideal for detecting objects and mapping roughness and texture. For imagery and object detection (wrecks, debris, lost nets), side-scan is the workhorse. For a direct comparison with bathymetric systems, manufacturers and survey houses outline the tradeoffs between side-scan, bathymetric side-scan (interferometric), and multibeam echosounders. R2Sonic.
Multibeam and single-beam echo sounders (MBES / SBES)
While side-scan provides imagery, bathymetry typically relies on multibeam echo sounders for dense depth coverage and high-quality digital elevation models (DEMs). Multibeam provides full-coverage swaths; single-beam is simpler and used for narrow channels or shallow water. Research reviews show MBES remains the standard for precise bathymetry and habitat mapping.
How the sensors complement one another in practice
Site clearance & object detection: side-scan finds obstructions; multibeam validates their height and footprint; SBP shows whether objects are buried or free-lying.
Dredging & port maintenance: SBP identifies silt depth and composition; bathymetry quantifies volumes; side-scan locates hard patches or buried debris to avoid equipment damage.
Cable/pipeline route surveys: SBP maps sediment thickness and buried rock; side-scan images seabed features and potential snag points; multibeam defines corridor bathymetry. These integrated products are standard deliverables for route engineering. Practical case descriptions exist in hydrographic and engineering literature.
Africa-specific considerations (geography, environments, seasonal dynamics):-
Africa’s waterways present a unique mix of survey environments:
1.Large inland lakes (Victoria, Tanganyika, Malawi): deep basins with variable sedimentation — SBP is invaluable for fisheries habitat mapping, reservoir management and paleoshoreline studies.
2.Seasonal rivers and deltas (Nile, Niger, Zambezi, Senegal): highly dynamic shoaling and scour, heavy seasonal sediment loads — repeated bathymetric + SBP surveys help track channel migration and sediment budgets.
3.Coastal shelves and estuaries: from Mediterranean ports in the north to the wide continental shelf off West Africa and the narrow, energetic coasts of East Africa — side-scan and MBES used for harbor approaches, SBP for foundation investigations.
4.Offshore basins: West and East Africa host major petroleum basins; exploration and infrastructure require deep-sea bathymetry, sub-bottom imaging, and seismic methods.
Operational realities in Africa affect survey design:
Variable access to specialized vessels and trained crews — often surveys use portable, pole-mounted systems or work with regional research vessels.
Weather windows (monsoons, rainy seasons) restrict fieldwork.
Satellite navigation coverage is robust, but local DGPS corrections and vessel calibration still essential to meet accuracy targets.
Environmental and permitting frameworks differ by country — early engagement with port authorities and regulators avoids delays.
For market context and rising demand across Middle East & Africa for hydrographic systems and survey services, recent market analyses (which include equipment growth, port expansion and offshore exploration drivers) provide useful strategic context.
Survey planning: practical checklist before leaving the quayside
1.Define objectives — navigation charting, dredge volume estimation, route clearance, environmental baseline, archaeological search. Clear objectives determine sensor mix and survey density.
2.Site reconnaissance & risk assessment — tides, currents, vessel traffic, fishing activity, submerged hazards. Plan safety and insurance accordingly.
3.Sensor selection — chirp or boomer for deeper penetration; chirp for high-res shallow layers; side-scan for object detection; MBES for high-resolution bathymetry.
4.Navigation & positioning strategy — choose GNSS + DGPS / RTK or RTK-GNSS corrections where centimeter to decimeter accuracy is needed; inertial navigation (IMU) for attitude and heave corrections improves MBES and SBP accuracy. Notable inertial navigation updates for marine surveying equipment were released by manufacturers in recent years.
5.Survey design — swath widths, line spacing, overlap, towfish altitude for side-scan, tow-fish depth and speed for SBP. Line spacing is selected based on required spatial resolution and vessel capability (grid pattern for bathymetry, parallel lines for side-scan).
6.Sound velocity & calibration — sound speed in water controls depth and penetration conversions. Measure profiles frequently (CTD / SVP cast) — typical practice is twice daily in variable conditions. This calibration step is essential to convert acoustics to accurate depths and sub-bottom depths.
7.Data management plan — storage, back-ups, metadata, processing workflow and deliverables (XYZ points, DEMs, backscatter mosaics, SBP SEG-Y, side-scan mosaics).
8.Environmental & stakeholder permits — some countries require permits for towed arrays or for surveys in protected areas. Engage early with port authorities and environmental agencies.
Field acquisition tips: maximizing data quality
Towfish height & speed: side-scan performance is height-sensitive — lower altitude improves resolution but increases risk in shallow or rough bottoms. SBP tow depth must be stable to ensure consistent coupling to the water column.
Overlap & redundancy: acquire at least 20–30% overlap for side-scan mosaics and multibeam swaths to allow robust mosaicking and to detect transient artifacts.
Motion compensation: apply real-time heave, roll and pitch corrections via an IMU/USBL to prevent mosaicking artifacts.
Environmental logging: always log tides, current, wind and sea state; these are essential in QC and interpretation of sediment redistribution and scour.
Quality control on the go: simple checks on depth soundings, backscatter anomalies, and SBP signal strength let you correct problems early rather than after a costly re-mobilization.
Processing workflows and interpretation:-
1.Sub-bottom profiler processing
Pre-processing: apply gain, bandpass filters, remove bubble noise and towfish noise.
Time-to-depth conversion: requires local sound velocity (water column) plus empirically derived velocity in the near-surface sediments; errors in velocity lead to depth misplacement of reflectors.
Stitching profiles: generate seismic cross-sections (SEG-Y) and pick key horizons (e.g., top of bedrock, major unconformities). SBP is quasi-seismic: interpretation skills akin to shallow seismic are essential.
Integration: correlate SBP horizons with borehole data (if available) or grab samples to validate sediment types.
2.Side-scan processing
Mosaic creation: correct for slant range, apply geometric correction, normalize intensity, and merge overlapping sonar lines into a coherent mosaic.
Object detection & classification: use manual picking plus automated anomaly detection (machine learning or thresholding) to identify targets for ground-truthing. Backscatter intensity can hint at substrate (rock vs. mud), but ground sampling yields definitive sediment classification.
Co-registration: align side-scan imagery with MBES bathymetry to overlay object images on actual depth maps.
3.Bathymetric processing
Sound velocity, tide and draft corrections: precise tide reduction (or tidal datum alignment) is required to produce usable charts and dredge volumes.
Cleaning & filtering: remove spurious pings, apply statistical filters and manual editing to produce final XYZ point clouds.
Gridding: produce DEMs at a resolution matching line spacing and survey intent (e.g., 0.5 m grid for harbor approaches, 10 m grid for wide shelf mapping).
Deliverables: point cloud (XYZ), DEM, backscatter mosaic, SEG-Y, SBP interpretations, CAD plans for engineering use, volume reports for dredging.
Comprehensive reviews of modern bathymetric acquisition and processing methods are available in the literature and reinforce the need for integrated processing pipelines.
Typical applications and Africa case examples:-
- Port & harbor engineering
Bathymetry + SBP are fundamental during expansion or maintenance dredging to determine silt volumes, locate buried obstructions and design quay foundations. Recent investments in African port infrastructure underscore the ongoing need for precise hydrography for safe navigation and cost planning. Market analyses show growth in maritime infrastructure projects driving equipment demand in the region. - River training and flood risk management
In braided or meandering rivers, SBP can map former channels and sediment fill; bathymetry quantifies bed levels, enabling engineers to design scour protection and models for flood inundation. - Underwater archaeology and heritage
Side-scan is the primary search tool for shipwreck surveys along Africa’s historic coasts; SBP reveals whether wrecks are buried or preserved just below the seabed. - Cable and pipeline routing
SBP maps shallow hardgrounds and buried rock that can affect trenching; side-scan images suggest seabed roughness and potential snag zones. Offshore energy projects in West and East Africa commonly require these surveys before any route permit or installation. Recent international examples of multi-disciplinary surveys also highlight how SBP and side-scan inform safe engineering design. - Environmental baseline and habitat mapping
Combining MBES bathymetry with side-scan backscatter and SBP stratigraphy produces habitat maps for fisheries management, MPAs and impact assessments. Multibeam backscatter and classification approaches have proven effective for seafloor habitat mapping in scientific studies.
Environmental, ethical and regulatory considerations:-
Acoustic footprint: high-energy sources (boomers, sparkers) can influence marine life; for sensitive areas, use low-impact chirp systems, schedule surveys to avoid critical seasons (e.g., fish spawning, marine mammal migrations), and consult local regulations.
Permits: many African coastal states require survey permits, especially for towed sources that might intersect protected areas or near-shore fisheries. Early stakeholder engagement prevents conflicts and delays.
Data sharing & security: seafloor and subsurface data can be sensitive (e.g., critical infrastructure locations). Secure storage, appropriate access controls and compliance with national data policies are mandatory, especially for defense or high-value commercial projects. Market reports highlight data security as an emerging challenge for IoT and connected maritime systems.
Emerging trends: autonomy, AI and predictive maintenance:-
Uncrewed platforms: USVs (unmanned surface vehicles), AUVs and tow-vehicles extend survey reach into difficult or hazardous waters. These platforms are increasingly fitted with chirp SBPs, side-scan and compact MBES for combined acquisition in a single pass. Reviews and recent projects show growing adoption of autonomous craft for bathymetry and sub-bottom work.
Machine learning in processing: automated object detection in side-scan mosaics and automated horizon picking in SBP sections speed up post-processing and reduce human fatigue, though expert QC remains essential.
Predictive maintenance: integrating sensor health telemetry and routine cleaning schedules into predictive maintenance programs reduces downtime for towed systems and maintains data quality — a practical opportunity noted across sensor-driven industries.
Common pitfalls and how to avoid them:-
Ignoring sound velocity: poor SVP practice produces depth and SBP depth errors — always measure and apply SVP profiles frequently.
Underestimating environmental windows: attempt surveys in calm conditions; rough seas destroy side-scan mosaics and create SBP noise. Plan with seasonal weather in mind.
Weak metadata & archiving: insufficient metadata (survey tracks, sensor settings, tidal reductions) makes data unusable. Implement a robust data management plan from day one.
Skipping ground-truthing: side-scan backscatter hints at substrate but grabs, cores or video are needed for definitive sediment classification and SBP correlation.
Deliverables that clients need (and appreciate):-
A clear, practical deliverable set usually includes:
- Cleaned XYZ point cloud and gridded DEM (with metadata and datum/tide references).
- Side-scan mosaics (georeferenced) with flagged anomalies/targets.
- SBP SEG-Y files and interpreted horizon picks with cross-sections.
- Dredge volume calculations, engineering cross-sections, CAD plans (if requested).
A concise technical report describing methods, equipment, processing steps, QC checks and any limitations. Transparency about uncertainty is critical — quantify vertical and horizontal accuracy and explain assumptions used in time-to-depth conversions.
Conclusion: Unlocking Africa’s Underwater Potential:-
Sub Bottom Profiler & Side Scan Sonar Bathymetric survey in Africa is far more than a combination of technologies — it is a unified, strategic approach to understanding what lies beneath the water’s surface. When these advanced survey methods work together, they reveal not just depth, but structure, stability, hidden risks, and untapped opportunities across Africa’s diverse marine and inland water environments.
From developing world-class ports and laying submarine cables to managing river floods and supporting offshore energy projects, integrating SBP, side-scan sonar, and precision bathymetry ensures smarter decisions and safer execution. Success, however, depends on partnering with knowledgeable professionals who truly understand Africa’s unique coastlines, vast lakes, dynamic rivers, and regulatory frameworks.
With the right expertise and technology, Sub Bottom Profiler & Side Scan Sonar Bathymetric survey in Africa becomes a powerful gateway — transforming underwater uncertainty into clear, reliable insight that drives confident progress.